Look up LTI errors with the Debug assistant
Open the Debug assistant, filter the logs on the tool that fails and read the error message.
A client or learner reports that an LTI tool doesn’t start or shows an error. In the Debug assistant you can see what went wrong: Linqur logs errors with their level, the tool, the message and the time.
Step by step
1. Open the logs
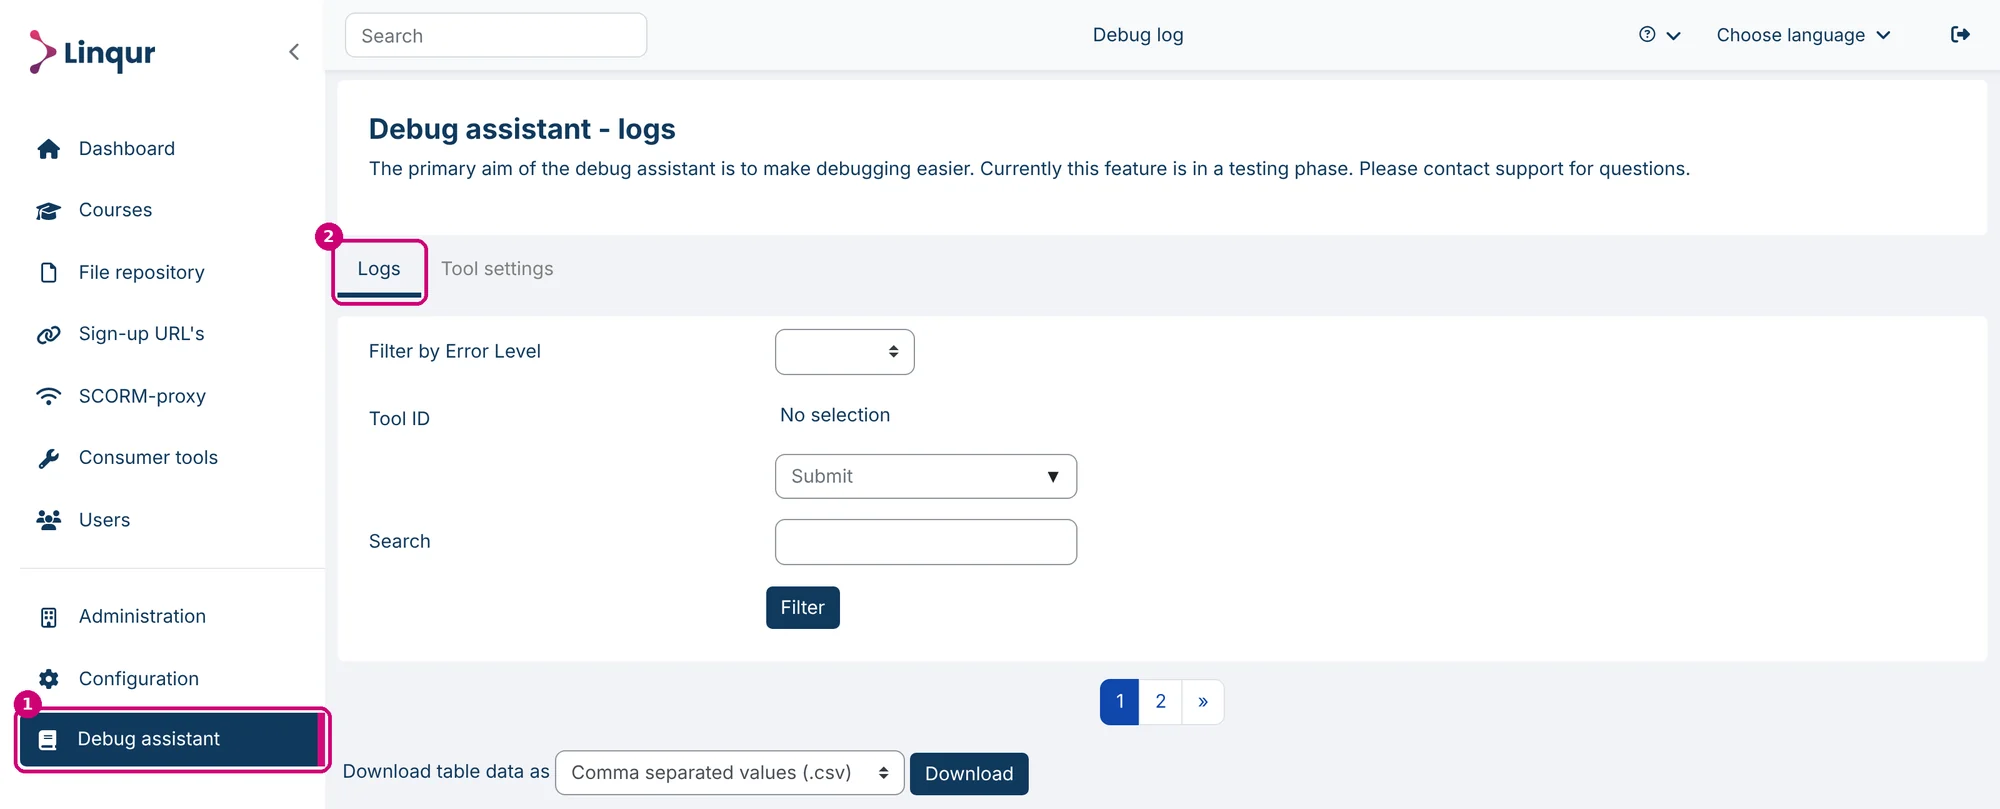
Click Debug assistant in the menu on the left (1). The Logs tab opens (2), with the filters above and the table with errors below.
2. Filter the logs
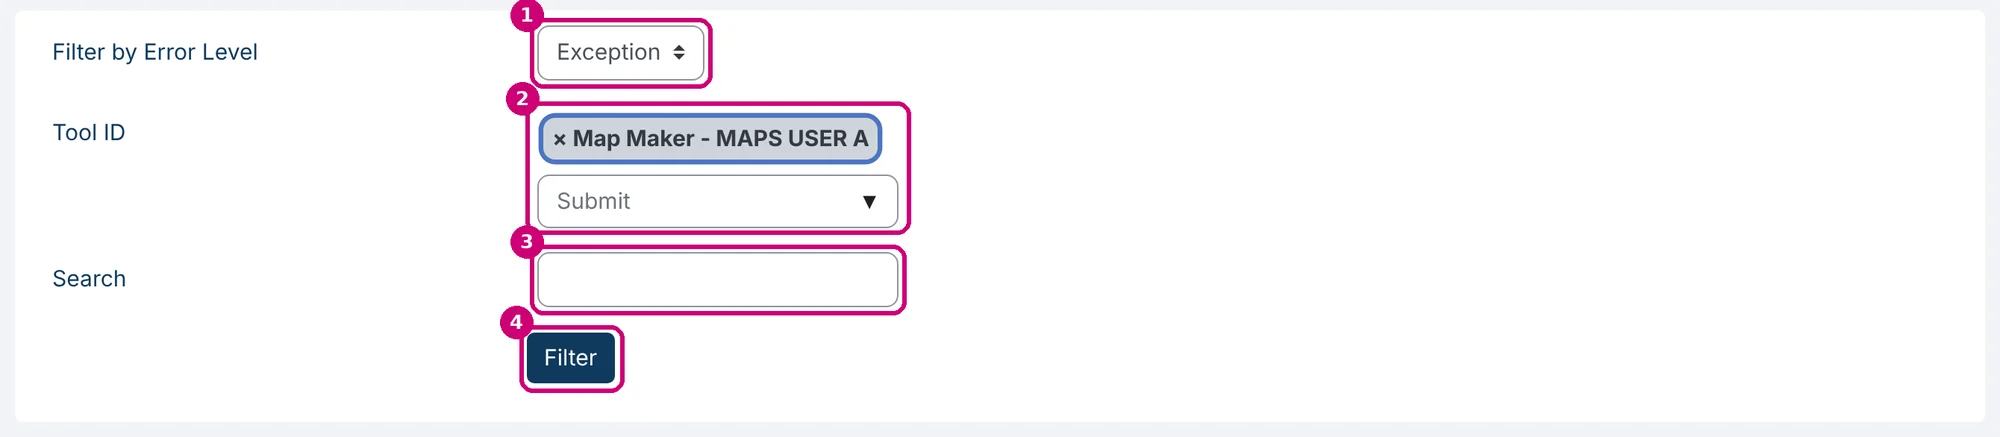
Narrow the table down with the filters:
- Filter by Error Level (1): Exception, General or Info.
- Tool ID (2): type part of the course name or tool name and pick the tool from the list. Each tool appears as “course name - tool name”.
- Search (3): a word from the error message.
Then click Filter (4).
The ID of a tool is at the top of its details page, see share the launch details of an LTI tool.
When you come back to the logs later, your last filter is still set. To see all lines again, empty the fields, remove the tool with the × and click Filter.
3. Read the line
The table now only shows the lines that match the filter.
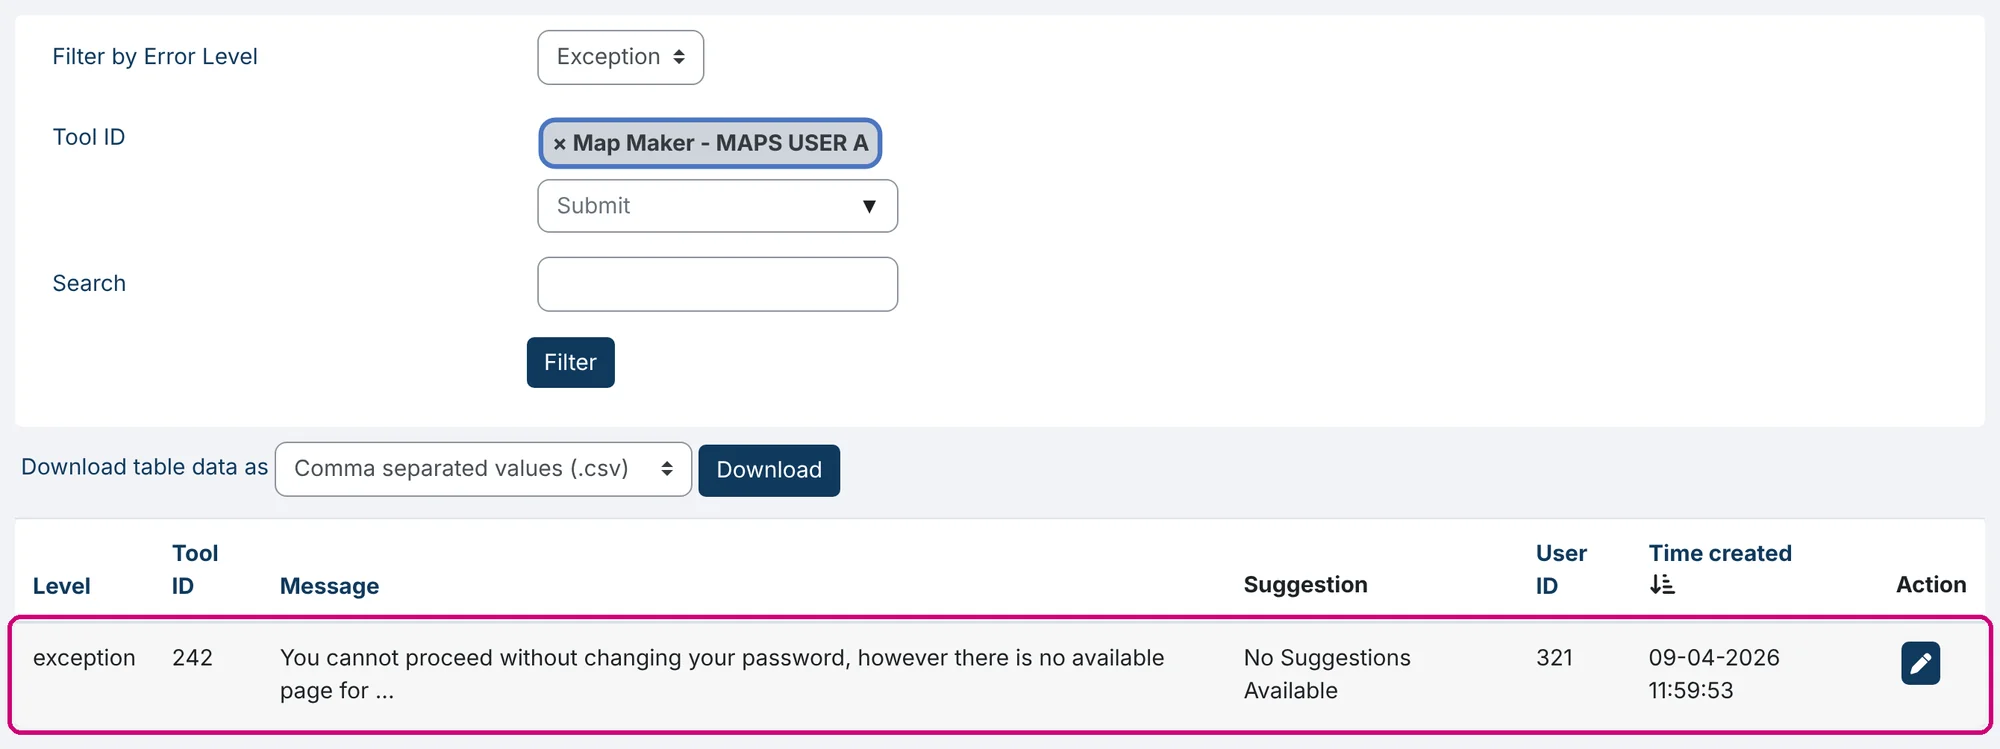
| Column | What it shows |
|---|---|
| Level | The error level: exception, general or info. |
| Tool ID | The tool the error belongs to. 0 means the error isn’t linked to a tool. |
| Message | The error message. Long messages are cut off with “…”. A message can be in English or in Dutch. |
| Suggestion | A possible cause, if the Debug assistant knows one. Otherwise it says “No Suggestions Available”. |
| User ID | The ID of the user who ran into the error, or 0. |
| Time created | The date and time of the error. The newest line is at the top. |
4. Download the table
Choose a format under Download table data as: CSV, Excel (.xlsx), HTML table, JSON, OpenDocument (.ods) or PDF. Then click Download. That’s useful when you want to send the errors to support.

The Tool settings tab
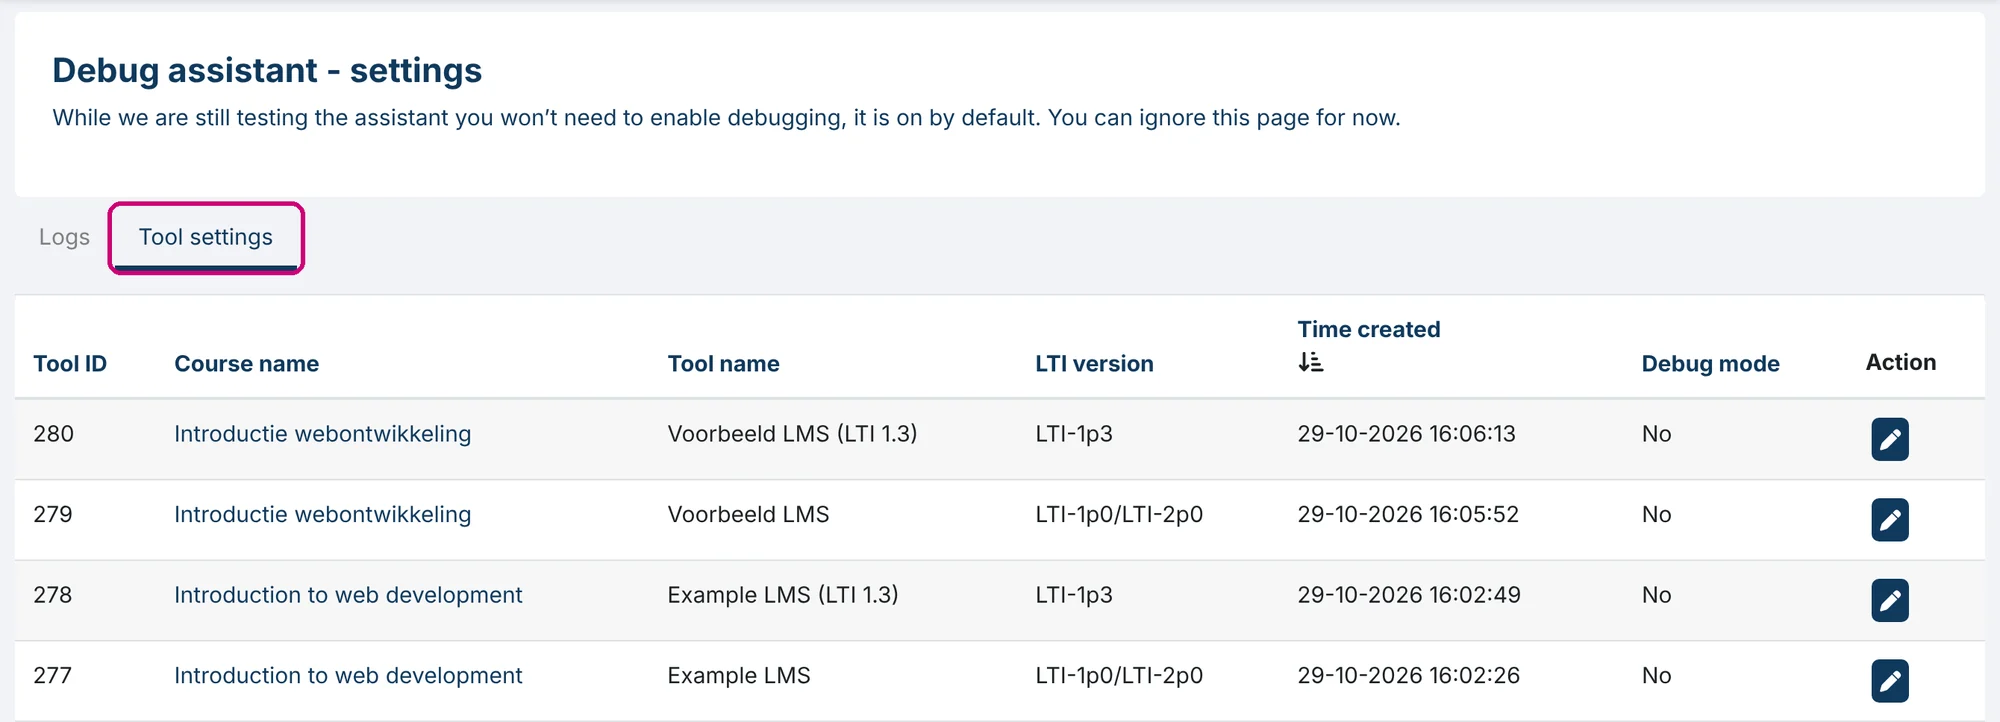
The Tool settings tab lists your LTI tools; while the Debug assistant is in its testing phase, debugging is on by default and you don’t need to do anything on this tab.
Next step
- Look the message up in the list of LTI errors and their solutions.
- Test the connection with Saltire to see whether the problem is in Linqur or in the LMS.
- Still stuck? Send support the message, the time and the tool ID, see get support.